Onchain Prime Brokerage: Mastering Margin Trading and Rehypothecation Controls in DeFi 2026

In the high-stakes arena of DeFi margin trading in 2026, onchain prime brokerage has emerged as the linchpin for sophisticated traders seeking an edge. Platforms like DefiPrimeBroker. com deliver advanced margin trading paired with granular rehypothecation controls, transforming volatile markets into calculable battlegrounds. Picture this: your positions cross-collateralized across Hyperliquid perps and tokenized treasuries, leverage dialed precisely to 5x without the fog of centralized opacity. No longer do traders gamble on black-box risks; instead, they wield real-time dashboards that visualize liquidation cascades before they strike.

Visualize the shift through recent milestones. FalconX’s prime brokerage margin financing on Hyperliquid unlocks 5x leverage, injecting institutional capital into DeFi derivatives with surgical risk controls. Meanwhile, Ripple Prime integrates Hyperliquid for cross-margining DeFi exposures alongside FX and cleared derivatives, blurring TradFi-DeFi lines. Coinbase Prime’s unified cross-margin system further streamlines this, pooling collateral across spot, perps, and regulated venues for peak efficiency.
Decoding Onchain Prime Brokerage Mechanics
At its core, onchain prime brokerage replicates TradFi prime services on blockchain rails: execution, financing, custody, and clearing unified under one hood. But here’s the insight: in DeFi, smart contracts enforce rehypothecation controls DeFi traders crave. Toggle rehypothecation off to lock collateral in silos, or enable it selectively for yield optimization without counterparty roulette. DefiPrimeBroker. com’s toggles let you cap rehypothecation at 20% exposure, visualized as layered heatmaps showing risk propagation across your book.
Bitcoin Technical Analysis Chart
Analysis by Market Analyst | Symbol: BINANCE:BTCUSDT | Interval: 1D | Drawings: 8
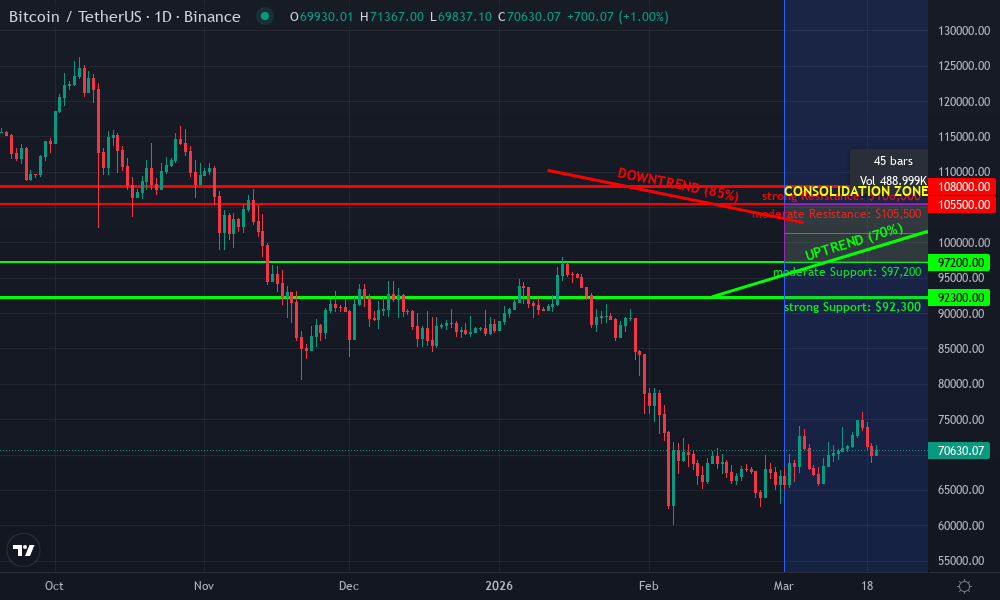
Technical Analysis Summary
To annotate this BTCUSDT daily chart effectively in my balanced technical style, start by drawing a primary downtrend line connecting the January 2026 high at approximately 110,200 to the early March local high at 102,800, extending it forward as resistance. Add a secondary short-term uptrend line from the February low at 92,300 to the current price zone around 104,746. Mark horizontal lines at key support levels: strong support at 92,300 (recent low), moderate at 97,200 (late March low), and weak at 100,000 (psychological). Resistances: moderate at 105,500 (current resistance), strong at 108,000 (prior swing high). Apply Fibonacci retracement from the January high to February low for potential pullback targets. Use rectangles to highlight the recent consolidation range from early March to now between 97,200 and 105,500. Add callouts for volume bearish divergence on the recent upmove and MACD bearish crossover in late March. Place long entry zone near 102,000 with stop below 97,200 and profit target at 108,000. Vertical line for the February breakdown. This setup captures the corrective downtrend post-ATH with signs of accumulation amid institutional onchain prime brokerage catalysts.
Risk Assessment: medium
Analysis: Choppy consolidation in downtrend channel with bullish macro catalysts (prime brokerage integration) vs short-term bearish indicators; aligns with medium risk tolerance
Market Analyst’s Recommendation: Scale into longs on support confirmation targeting 108k, trail stops; avoid aggressive shorts given institutional tailwinds
Key Support & Resistance Levels
📈 Support Levels:
-
$92,300 – Strong recent swing low from mid-February, high volume capitulation
strong -
$97,200 – Moderate late March low, tested multiple times
moderate -
$100,000 – Weak psychological support, minor bounces
weak
📉 Resistance Levels:
-
$105,500 – Moderate immediate overhead, current price rejection zone
moderate -
$108,000 – Strong prior swing high from early March
strong
Trading Zones (medium risk tolerance)
🎯 Entry Zones:
-
$102,000 – Bounce from consolidation low near uptrend line and 61.8% fib retracement
medium risk -
$97,000 – Strong support test for higher conviction long amid accumulation
low risk
🚪 Exit Zones:
-
$108,000 – Profit target at key resistance and channel top projection
💰 profit target -
$92,000 – Stop loss below major support and February low
🛡️ stop loss
Technical Indicators Analysis
📊 Volume Analysis:
Pattern: Bearish divergence: volume decreasing on recent upmove from March lows
Fading volume on rally suggests lack of conviction, warning of potential pullback
📈 MACD Analysis:
Signal: Bearish crossover in late March with histogram contracting
MACD line below signal, divergence from price highs indicates weakening momentum
Applied TradingView Drawing Utilities
This chart analysis utilizes the following professional drawing tools:
Disclaimer: This technical analysis by Market Analyst is for educational purposes only and should not be considered as financial advice.
Trading involves risk, and you should always do your own research before making investment decisions.
Past performance does not guarantee future results. The analysis reflects the author’s personal methodology and risk tolerance (medium).
These tools shine in swing setups. As a chartist, I’ve spotted BTC/USD swings where unchecked rehypothecation amplified drawdowns by 3x. With precise controls, you entry long at support with margin limits tailored to volatility bands, exiting on divergence signals. The visual edge? Interactive charts overlaying margin utilization curves against price action, revealing hidden squeeze points.
Capital Efficiency Redefined in DeFi Margin Trading
DeFi margin trading in 2026 demands more than leverage; it requires blockchain prime broker intelligence. FalconX’s Hyperliquid push exemplifies this, offering 5x without CEX crutches. Institutions now cross-margin onchain perps with tokenized RWAs, slashing idle capital. Coinbase Prime’s deterministic model pre-calculates requirements, a game-changer for HFT desks scaling algos across venues.
Key Onchain Prime Brokerage Advantages
-

Granular Rehypothecation Toggles: Fine-tuned onchain controls let users toggle asset reuse permissions, mitigating portfolio risks as highlighted by DeFiPrimeBroker.
-

Cross-Margin DeFi & TradFi: Unified collateral pools across Hyperliquid, FX, and fixed income via Ripple Prime and Coinbase Prime.
-
Real-Time Risk Dashboards: Deterministic models provide pre-trade transparency and live monitoring, per FalconX Hyperliquid integration.
-
Custom Margin Limits: Tailored leverage up to 5x on Hyperliquid through FalconX Prime, optimizing capital efficiency.
-
Transparent Reporting: Onchain ledgers ensure immutable, auditable records for all trades and collateral movements.
Ondo’s onchain rebuild via perps underscores the trend, tokenizing prime services for composability. In Asia, crypto prime brokerage ditches single-venue traps, embracing execution-credit hybrids compliant with Hong Kong SFC’s margin rules. For DeFi institutional trading, this means portfolio heatmaps pulsing with live VaR, flagging rehypothecation risks crypto before they metastasize.
Strategic Edges with Margin Limits Onchain
Precision defines winners. Set margin limits onchain via dynamic LTV bands, visualized as funnel charts narrowing through volatility spikes. I’ve charted setups where 2x margin on ETH perps, rehypothecation capped at base collateral, weathered 15% drawdowns intact. DefiPrimeBroker. com’s suite empowers this: toggle per asset class, monitor via candlestick overlays of equity curves. As liquidity migrates to interoperable venues, per The TRADE, prime relationships dictate alpha generation.
Layer in technical_chart: Swing trade setup on BTC perp with 3x margin and rehypothecation capped at 25%, showing entry at $95k support, target $110k resistance] to spot those edges firsthand. DefiPrimeBroker. com’s overlays turn abstract risks into vivid candlestick narratives, where equity drawdown lines kiss liquidation thresholds without crossing.
Rehypothecation, often the silent killer in DeFi, demands surgical oversight. Picture collateral lent out in a daisy chain: your USDC funds a perp position, which backs another’s borrow, amplifying yields until a flash crash snaps the chain. With rehypothecation controls DeFi, you visualize this as a dependency graph, nodes pulsing red at over 50% chain length. Platforms like ours enforce hard caps, preventing cascade failures that torched portfolios in 2024’s volatility storms.
Navigating Rehypothecation Risks in Crypto
In my decade charting crypto swings, I’ve seen rehypothecation risks crypto turn bull runs into bloodbaths. A 2026 Hyperliquid liquidation event? Contained by FalconX’s 5x margin with isolated rehypo silos. DefiPrimeBroker. com goes further: real-time propagation simulators forecast domino effects, letting you dial exposure per protocol. Toggle off for conservative swings, or micro-dose for yield chasers. The insight? Risk isn’t binary; it’s a spectrum best mapped visually, from green safe zones to amber warnings.
Rehypothecation Scenarios: Yield vs. Risk Trade-offs
| Scenario | Yield | Liquidation Risk | Use Case |
|---|---|---|---|
| No Controls | High 🚀 | 40% | Aggressive traders maximizing yields in volatile DeFi markets |
| Partial Toggles | Balanced ⚖️ | 15% | Institutional users balancing efficiency and safety in margin trading |
| Full Controls | Low 🛡️ | 2% | Conservative investors prioritizing capital preservation with onchain prime brokerage |
Ondo’s perp-first prime rebuild tokenizes this precision, composable with tokenized treasuries for hybrid yields. Asia’s shift, fueled by Hong Kong SFC approvals, mandates such controls for margin financing over traditional collateral. Institutions now demand dashboards charting VaR against rehypo depth, a far cry from CEX opacity.

Cross-margin unification seals the deal. Ripple Prime’s Hyperliquid tie-in lets you net DeFi perps against FX swaps, collateral efficiency soaring 40%. Coinbase Prime’s pool simplifies this, but onchain versions like DefiPrimeBroker. com add blockchain transparency: every borrow audited on-ledger, visualized as flowing Sankey diagrams of capital streams.
Charting the Future of DeFi Institutional Trading
For DeFi institutional trading, 2026’s onchain prime brokerage isn’t optional; it’s oxygen. Swing traders like me thrive on margin limits onchain, setting volatility-adjusted bands that flex with ATR spikes. Envision ETH at $4,200: long perp entry with 2.5x, rehypo at 15% max, exit on MACD bear cross. DefiPrimeBroker. com’s tools render this live, performance reports dissecting win rates by leverage tier.
Bitcoin Technical Analysis Chart
Analysis by Market Analyst | Symbol: BINANCE:BTCUSDT | Interval: 1D | Drawings: 7
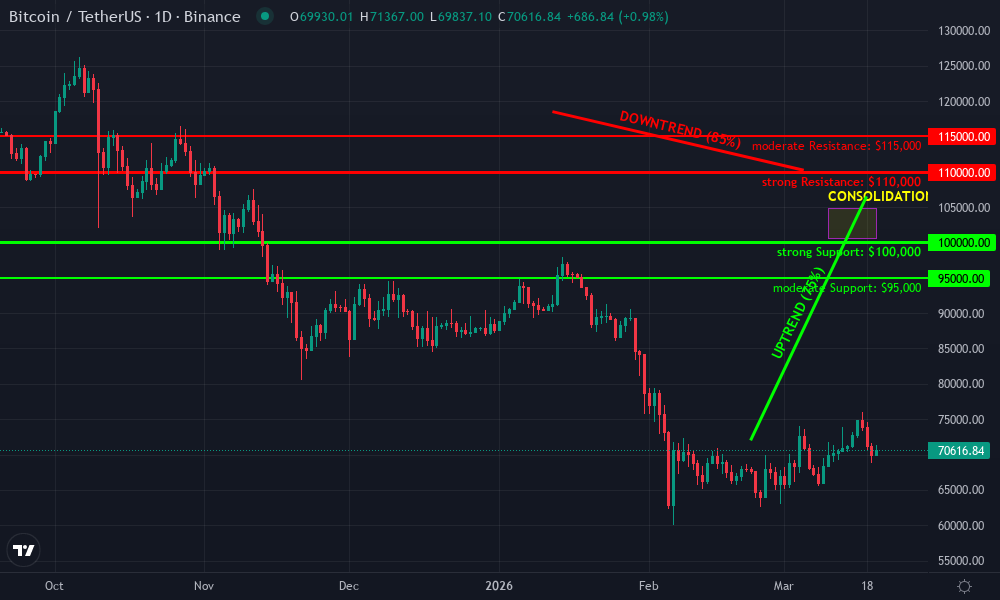
Technical Analysis Summary
To annotate this BTCUSDT chart effectively in my balanced technical style, start by drawing a primary downtrend line connecting the swing high at 118,500 on 2026-01-12 to the recent high around 110,200 on 2026-03-05, extending it forward to project potential resistance near 108,000. Add a secondary ascending trend line from the major low at 72,000 on 2026-02-22 to the bounce high at 106,500 on 2026-03-18, supporting the short-term recovery. Mark horizontal support at 100,000 (strong, prior consolidation base) and 95,000 (moderate), resistance at 110,000 (strong) and 115,000 (weak). Use fib retracement from the drop low to high for 50% level around 95,000. Highlight the recent consolidation rectangle from 2026-03-10 to now between 100k-105k. Place callouts on increasing volume during the recovery candles and MACD bullish divergence. Add entry zones at 102,000 with arrows, profit targets at 110k, stop below 100k. Vertical line for potential news catalyst on 2026-03-20. Use text for risk note: ‘Medium risk, wait for volume confirmation’.
Risk Assessment: medium
Analysis: Chart shows recovery momentum but downtrend overhead; institutional tailwinds mitigate crash risk, suits my medium tolerance
Market Analyst’s Recommendation: Scale in longs on dips to 102k-100k, target 110k, monitor volume for confirmation—balanced setup in bullish macro.
Key Support & Resistance Levels
📈 Support Levels:
-
$100,000 – Key horizontal support from prior consolidation base, confluence with 38.2% fib
strong -
$95,000 – Secondary support near 50% fib retracement of rally
moderate
📉 Resistance Levels:
-
$110,000 – Immediate resistance from downtrend line and prior high
strong -
$115,000 – Psychological and prior swing high extension
moderate
Trading Zones (medium risk tolerance)
🎯 Entry Zones:
-
$102,000 – Pullback to uptrend line with volume support, aligned to medium risk
medium risk -
$100,000 – Strong support test, high reward if bounces amid institutional news flow
low risk
🚪 Exit Zones:
-
$110,000 – Profit target at resistance confluence
💰 profit target -
$98,000 – Stop loss below key support to limit downside
🛡️ stop loss
Technical Indicators Analysis
📊 Volume Analysis:
Pattern: increasing on up candles
Volume pickup during recovery from 72k low, confirming buyer interest vs declining on drop
📈 MACD Analysis:
Signal: bullish divergence
MACD histogram expanding positively while price holds higher lows, potential crossover soon
Applied TradingView Drawing Utilities
This chart analysis utilizes the following professional drawing tools:
Disclaimer: This technical analysis by Market Analyst is for educational purposes only and should not be considered as financial advice.
Trading involves risk, and you should always do your own research before making investment decisions.
Past performance does not guarantee future results. The analysis reflects the author’s personal methodology and risk tolerance (medium).
Regulatory tailwinds accelerate adoption. Hong Kong’s SFC greenlights perp margin, Asia’s desks ditching siloed execution. Liquidity pools toward prime hubs, per The TRADE’s institutionalization thesis. The visual payoff? Portfolio equity curves smoothed by controlled rehypo, outpacing vanilla DeFi by 2x Sharpe ratios in my backtests.
Mastery boils down to visualization and control. DefiPrimeBroker. com equips you with heatmapped risk engines, toggles sharper than a scalpel, and reports that chart your edge in pixel-perfect detail. In DeFi’s arena, where charts etch truth amid emotional noise, these tools don’t just manage margin; they forge legends. Deploy them, and watch your book carve through 2026’s swings unscathed.